STAT 432
  • Welcome
  • Lectures
    • Overview
    • Week 1: Setup and AI Tools
    • Week 2: Training and Test Error
    • Week 3: Ridge Regression and Optimization
    • Week 4: Lasso and Variable Selection
    • Week 5: K-Nearest Neighbors
    • Week 6: Classification Error and Evaluation
  • Discussion
  • Quizzes
  • Final Project
  • Syllabus
  • Canvas
Skip to main content

Homework 03 Solutions

On this page

  • Before you begin
  • Question 1: Build an explain-to-me skill
  • Question 2: Ridge regression with nearly collinear predictors
  • Question 3: What does ridge regression shrink?
  • Question 4: Ridge regression and optimization
  • Question 5: Selecting the ridge penalty for real-estate prediction
  • Reference

Before you begin

Each solution repeats the complete question before presenting the reasoning. Questions 2 and 5 include both R and Python solutions, but students need to use only one language. The two languages use the same real data, split, folds, penalty grid, and ridge objective. Their Question 2 simulation results differ slightly because R and Python use different random-number generators.

Download the materials

  • Download solutions-03.qmd
  • Download homework-03.qmd
  • Download combined ZIP file

The ZIP file contains the two editable QMD files and the two real-estate data files. All simulation results are generated by the solution code.

Question 1: Build an explain-to-me skill

Original question

Create a small skill named explain-to-me that helps you understand a homework question.

  1. Design your SKILL.md file so that, when you explicitly ask your agent to use the skill to read a homework question, the agent communicates with you and explains what the question is asking.

  2. Keep the skill file short. It should contain a few useful rules, instructions, and a clear statement of your intent. For example, you may ask the agent to explain the goal of the question, clarify what work is required, and point you to an appropriate section of the Week 3 lectures: Ridge Regression: Stability Through Shrinkage or From a Penalized Objective to a Fitted Ridge Model. The skill should help you understand the question without completing the solution for you.

  3. Create the skill yourself or with the help of AI. Save it as explain-to-me/SKILL.md. Then ask your AI agent to install the skill using its normal skill-installation method. Test it by explicitly asking the agent to use explain-to-me to read and explain Question 2.

  4. If the skill does not work well, or if it begins to disturb your usual workflow, ask your agent to remove the installed skill. You may revise and reinstall it if you wish.

  5. In all cases, append the complete contents of your developed explain-to-me/SKILL.md file at the end of your Homework 3 submission under the heading explain-to-me skill.

Solution

Many short skill files can satisfy the requirements. The following is one example of explain-to-me/SKILL.md:

---
name: explain-to-me
description: Use when a student explicitly asks for help understanding a STAT 432 homework question without requesting its solution.
---

# Intent

Help me understand a homework question while leaving the mathematical and computational work for me to complete.

# Instructions

- Read the complete question before responding.
- Explain its main goal and what I am expected to submit in clear, conversational language.
- Preserve the notation used in the question.
- For Questions 2 and 3, use [Ridge Regression: Stability Through Shrinkage](https://teazrq.github.io/stat432rpy/topics/ridge-regression/ridge-regression.html). For Questions 4 and 5, use [From a Penalized Objective to a Fitted Ridge Model](https://teazrq.github.io/stat432rpy/topics/ridge-regression/optimization-and-cross-validation.html). Point me to one relevant section within that page and explain briefly why it will help. Do not invent a section if you cannot access the page.
- Suggest a reasonable first step, then ask what part remains unclear.
- Do not carry out the calculations or derivations, write solution code, or give me the final answer.

The front matter gives the skill a clear name and says when it should be used. The intent statement tells the agent the kind of help the student wants. The remaining rules are short and practical: explain the task conversationally, preserve the course notation, use the two supplied Week 3 lecture links, and leave the solution work to the student. The question-to-page mapping limits the search to the appropriate lecture while still asking the agent to choose a useful section. Testing the installed skill on Question 2 reveals whether these instructions produce a useful conversation. If the skill activates at unwanted times or otherwise interferes with the student’s workflow, removing it is a reasonable response.

Question 2: Ridge regression with nearly collinear predictors

Original question

Let n=100n=100. Generate mutually independent standard normal random variables

Li,Ui1,Ui2,Xi3,Xi4,i=1,…,n, L_i, U_{i1}, U_{i2}, X_{i3}, X_{i4}, \qquad i=1,\ldots,n,

and define

Xi1=Li+0.04Ui1,Xi2=Li+0.04Ui2. X_{i1}=L_i+0.04U_{i1}, \qquad X_{i2}=L_i+0.04U_{i2}.

Center and standardize each column of 𝑿\mathbf X to have mean zero and average squared value one, following the lecture’s scaling convention.

Continue to use π‘Ώβˆˆβ„nΓ—p\mathbf X\in\mathbb R^{n\times p} for the standardized matrix and keep it fixed throughout the question, where p=4p=4 is the number of predictors. The unpenalized intercept gives p+1=5p+1=5 total fitted coefficients. Let

𝜷=(1.5,1.5,1,0)𝖳,𝝁=π‘Ώπœ·. \boldsymbol\beta = (1.5,1.5,1,0)^{\mathsf T}, \qquad \boldsymbol\mu = \mathbf X\boldsymbol\beta.

Generate a training response and an independent test response at the same predictor values:

π’š=𝝁+𝝐,π’š*=𝝁+𝝐*, \begin{aligned} \mathbf y &= \boldsymbol\mu+\boldsymbol\epsilon,\\ \mathbf y^* &= \boldsymbol\mu+\boldsymbol\epsilon^*, \end{aligned}

where

𝝐,𝝐*∼ind𝒩n(𝟎,𝑰n). \boldsymbol\epsilon, \boldsymbol\epsilon^* \overset{\mathrm{ind}}{\sim} \mathcal N_n(\mathbf0,\mathbf I_n).

Center the training response as π’šΜƒ=π’šβˆ’yβ€ΎπŸn\widetilde{\mathbf y}=\mathbf y-\bar y\mathbf1_n. For each λ∈{0,0.02,0.2}\lambda\in\{0,0.02,0.2\}, fit the slopes using the lecture’s ridge formula:

πœ·Μ‚Ξ»=(𝑿𝖳𝑿+nλ𝑰p)βˆ’1π‘Ώπ–³π’šΜƒ. \widehat{\boldsymbol\beta}_\lambda = \left(\mathbf X^{\mathsf T}\mathbf X+n\lambda\mathbf I_p\right)^{-1} \mathbf X^{\mathsf T}\widetilde{\mathbf y}.

The unpenalized intercept is Ξ²Μ‚0=yβ€Ύ\widehat\beta_0=\bar y; add this training mean back when predicting either response. The case Ξ»=0\lambda=0 is ordinary least squares. Use seed 43231 before generating the design and responses. R and Python use different random-number generators, so their exact numerical results need not agree.

  1. Generate 𝑿\mathbf X once. Report the correlation between its first two columns and its largest and smallest singular values. Use these quantities to explain why the estimator contrast Ξ²Μ‚1βˆ’Ξ²Μ‚2\widehat\beta_1-\widehat\beta_2 should be much more variable than Ξ²Μ‚1+Ξ²Μ‚2\widehat\beta_1+\widehat\beta_2.

  2. Independently repeat the generation of π’š\mathbf y and π’š*\mathbf y^*, followed by all three fits, 200 times while keeping 𝑿\mathbf X fixed. Draw the training and test noise inside each repetition, then reuse that realized pair for all three values of Ξ»\lambda. For each value of Ξ»\lambda, report the empirical mean and standard deviation of

Ξ²Μ‚1,Ξ²Μ‚2,Ξ²Μ‚1+Ξ²Μ‚2,Ξ²Μ‚1βˆ’Ξ²Μ‚2. \widehat\beta_1, \quad \widehat\beta_2, \quad \widehat\beta_1+\widehat\beta_2, \quad \widehat\beta_1-\widehat\beta_2.

Also report the average training MSE and the average test MSE calculated from the independent test response, where

MSE⁑test=1nβˆ₯π’š*βˆ’Ξ²Μ‚0𝟏nβˆ’π‘Ώπœ·Μ‚βˆ₯22. \operatorname{MSE}_{\mathrm{test}} = \frac{1}{n} \left\lVert \mathbf y^* - \widehat\beta_0\mathbf1_n - \mathbf X\widehat{\boldsymbol\beta} \right\rVert_2^2.

  1. Interpret the coefficient estimates and test MSE using bias and variance. Explain why ridge can substantially stabilize the individual coefficients without producing an equally large change in the fitted values.
Solution

The first two predictors are almost identical. Their sum is a well-observed direction because both columns change together. Their difference is a weak direction because 𝒙1βˆ’π’™2\mathbf x_1-\mathbf x_2 is nearly zero. A small singular value records this lack of information.

The following code generates the design once and changes only the two response vectors across the 200 repetitions.

  • R
  • Python
Show the solution code
set.seed(43231)
n <- 100
p <- 4
repetitions <- 200

# Generate one design and keep it fixed.
L <- rnorm(n)
U1 <- rnorm(n)
U2 <- rnorm(n)
X <- cbind(
  L + 0.04 * U1,
  L + 0.04 * U2,
  rnorm(n),
  rnorm(n)
)

x_bar <- colMeans(X)
X <- sweep(X, 2, x_bar, "-")
s <- sqrt(colMeans(X^2))
X <- sweep(X, 2, s, "/")

beta <- c(1.5, 1.5, 1, 0)
mu <- drop(X %*% beta)
lambda_grid <- c(0, 0.02, 0.2)

# Axes: repetitions, coefficients, and penalties.
beta_hat <- array(
  NA_real_,
  c(repetitions, p, length(lambda_grid))
)
train_mse <- test_mse <- matrix(
  NA_real_,
  repetitions,
  length(lambda_grid)
)

for (k in seq_len(repetitions)) {
  y <- mu + rnorm(n)
  y_test <- mu + rnorm(n)
  y_centered <- y - mean(y)

  for (l in seq_along(lambda_grid)) {
    lambda <- lambda_grid[l]
    beta_hat[k, , l] <- solve(
      crossprod(X) + n * lambda * diag(p),
      crossprod(X, y_centered)
    )
    y_hat <- mean(y) + drop(X %*% beta_hat[k, , l])

    train_mse[k, l] <- mean((y - y_hat)^2)
    test_mse[k, l] <- mean((y_test - y_hat)^2)
  }
}

coefficient_rows <- lapply(
  seq_along(lambda_grid),
  function(l) {
    data.frame(
      lambda = lambda_grid[l],
      beta1 = sprintf(
        "%.3f (%.3f)",
        mean(beta_hat[, 1, l]), sd(beta_hat[, 1, l])
      ),
      beta2 = sprintf(
        "%.3f (%.3f)",
        mean(beta_hat[, 2, l]), sd(beta_hat[, 2, l])
      ),
      sum = sprintf(
        "%.3f (%.3f)",
        mean(beta_hat[, 1, l] + beta_hat[, 2, l]),
        sd(beta_hat[, 1, l] + beta_hat[, 2, l])
      ),
      difference = sprintf(
        "%.3f (%.3f)",
        mean(beta_hat[, 1, l] - beta_hat[, 2, l]),
        sd(beta_hat[, 1, l] - beta_hat[, 2, l])
      )
    )
  }
)
coefficient_summary <- do.call(rbind, coefficient_rows)
error_summary <- data.frame(
  lambda = lambda_grid,
  training_mse = colMeans(train_mse),
  test_mse = colMeans(test_mse)
)

singular_values <- svd(X, nu = 0, nv = 0)$d
print(c(
  correlation = cor(X[, 1], X[, 2]),
  largest_singular_value = max(singular_values),
  smallest_singular_value = min(singular_values)
), digits = 4)
            correlation  largest_singular_value smallest_singular_value 
                 0.9977                 14.1415                  0.4754 
Show the solution code
knitr::kable(
  coefficient_summary,
  caption = "Empirical mean (standard deviation) across 200 repetitions"
)
Empirical mean (standard deviation) across 200 repetitions
lambda beta1 beta2 sum difference
0.00 1.496 (1.544) 1.510 (1.549) 3.005 (0.095) -0.014 (3.091)
0.02 1.487 (0.162) 1.489 (0.166) 2.976 (0.094) -0.002 (0.314)
0.20 1.368 (0.046) 1.369 (0.047) 2.737 (0.086) -0.001 (0.034)
Show the solution code
knitr::kable(
  error_summary,
  digits = 3,
  caption = "Average training and test MSE"
)
Average training and test MSE
lambda training_mse test_mse
0.00 0.965 1.062
0.02 0.975 1.049
0.20 1.077 1.133
Show the solution code
import numpy as np
import pandas as pd

rng = np.random.default_rng(43231)
n, p, repetitions = 100, 4, 200

# Generate one design and keep it fixed.
L = rng.normal(size=n)
U1 = rng.normal(size=n)
U2 = rng.normal(size=n)
X = np.column_stack(
    (L + 0.04 * U1, L + 0.04 * U2, rng.normal(size=n), rng.normal(size=n))
)

x_bar = X.mean(axis=0)
X = X - x_bar
s = np.sqrt(np.mean(X**2, axis=0))
X = X / s

beta = np.array([1.5, 1.5, 1.0, 0.0])
mu = X @ beta
lambda_grid = np.array([0.0, 0.02, 0.2])

# Axes: repetitions, coefficients, and penalties.
beta_hat = np.empty((repetitions, p, len(lambda_grid)))
train_mse = np.empty((repetitions, len(lambda_grid)))
test_mse = np.empty((repetitions, len(lambda_grid)))

for k in range(repetitions):
    y = mu + rng.normal(size=n)
    y_test = mu + rng.normal(size=n)
    y_centered = y - y.mean()

    for l, lam in enumerate(lambda_grid):
        beta_hat[k, :, l] = np.linalg.solve(
            X.T @ X + n * lam * np.eye(p),
            X.T @ y_centered,
        )
        y_hat = y.mean() + X @ beta_hat[k, :, l]

        train_mse[k, l] = np.mean((y - y_hat) ** 2)
        test_mse[k, l] = np.mean((y_test - y_hat) ** 2)

coefficient_rows = []
for l, lam in enumerate(lambda_grid):
    coefficient_rows.append(
        {
            "lambda": lam,
            "beta1": (
                f"{beta_hat[:, 0, l].mean():.3f} "
                f"({beta_hat[:, 0, l].std(ddof=1):.3f})"
            ),
            "beta2": (
                f"{beta_hat[:, 1, l].mean():.3f} "
                f"({beta_hat[:, 1, l].std(ddof=1):.3f})"
            ),
            "sum": (
                f"{(beta_hat[:, 0, l] + beta_hat[:, 1, l]).mean():.3f} "
                f"({(beta_hat[:, 0, l] + beta_hat[:, 1, l]).std(ddof=1):.3f})"
            ),
            "difference": (
                f"{(beta_hat[:, 0, l] - beta_hat[:, 1, l]).mean():.3f} "
                f"({(beta_hat[:, 0, l] - beta_hat[:, 1, l]).std(ddof=1):.3f})"
            ),
        }
    )

coefficient_summary = pd.DataFrame(coefficient_rows)
error_summary = pd.DataFrame(
    {
        "lambda": lambda_grid,
        "training_mse": train_mse.mean(axis=0),
        "test_mse": test_mse.mean(axis=0),
    }
)

singular_values = np.linalg.svd(X, compute_uv=False)
print(
    pd.Series(
        {
            "correlation": np.corrcoef(X[:, 0], X[:, 1])[0, 1],
            "largest_singular_value": singular_values.max(),
            "smallest_singular_value": singular_values.min(),
        }
    ).round(4)
)
correlation                 0.9983
largest_singular_value     14.1730
smallest_singular_value     0.4061
dtype: float64
Show the solution code
print(coefficient_summary.to_string(index=False))
 lambda         beta1         beta2           sum     difference
   0.00 1.290 (1.795) 1.701 (1.798) 2.992 (0.105) -0.411 (3.592)
   0.02 1.465 (0.145) 1.497 (0.148) 2.961 (0.104) -0.032 (0.274)
   0.20 1.355 (0.049) 1.359 (0.050) 2.715 (0.095) -0.004 (0.029)
Show the solution code
print(error_summary.round(3).to_string(index=False))
 lambda  training_mse  test_mse
   0.00         0.949     1.038
   0.02         0.960     1.029
   0.20         1.064     1.125

The correlation is about 0.9980.998. The smallest singular value is approximately 0.40.4 to 0.50.5, whereas the largest is about 1414. The design therefore contains much less information in its weakest direction.

The individual OLS coefficients have large standard deviations, and the coefficient difference is particularly unstable. In contrast, the estimated sum has a standard deviation of about 0.10.1. Ridge with Ξ»=0.02\lambda=0.02 sharply reduces the variability of the individual coefficients and the difference while changing the sum relatively little.

The stronger penalty Ξ»=0.2\lambda=0.2 reduces variance further, but it also shrinks the coefficient sum noticeably below its true value of 33. That additional bias raises the test MSE in both language implementations. The intermediate penalty gives a slightly smaller average test MSE than OLS in this simulation.

Question 3: What does ridge regression shrink?

Original question

Let π‘Ώβˆˆβ„nΓ—p\mathbf X\in\mathbb R^{n\times p} be a centered predictor matrix, and let π’šΜƒβˆˆβ„n\widetilde{\mathbf y}\in\mathbb R^n be the centered response. Use the supplied predictor scales for this algebraic question; the columns need not have unit variance. Here pp counts predictors, πœ·βˆˆβ„p\boldsymbol\beta\in\mathbb R^p contains their slopes, and p+1p+1 counts all fitted coefficients, including the separately fitted, unpenalized intercept. Ridge regression minimizes

LΞ»(𝜷)=12nβˆ₯π’šΜƒβˆ’π‘Ώπœ·βˆ₯22+Ξ»2β€–πœ·β€–22. L_\lambda(\boldsymbol\beta) = \frac{1}{2n} \left\lVert \widetilde{\mathbf y}-\mathbf X\boldsymbol\beta \right\rVert_2^2 + \frac{\lambda}{2} \lVert\boldsymbol\beta\rVert_2^2.

  1. Derive the ridge normal equation

(𝑿𝖳𝑿+nλ𝑰p)πœ·Μ‚Ξ»=π‘Ώπ–³π’šΜƒ. \left( \mathbf X^{\mathsf T}\mathbf X +n\lambda\mathbf I_p \right) \widehat{\boldsymbol\beta}_\lambda = \mathbf X^{\mathsf T}\widetilde{\mathbf y}.

Explain why it has a unique solution whenever Ξ»>0\lambda>0, even if 𝑿\mathbf X is rank deficient or p>np>n.

  1. Let

𝑿=𝑼r𝑫r𝑽r𝖳 \mathbf X = \mathbf U_r\mathbf D_r\mathbf V_r^{\mathsf T}

be a compact singular value decomposition, where r=rank⁑(𝑿)r=\operatorname{rank}(\mathbf X), 𝑼rβˆˆβ„nΓ—r\mathbf U_r\in\mathbb R^{n\times r}, 𝑫rβˆˆβ„rΓ—r\mathbf D_r\in\mathbb R^{r\times r}, and 𝑽rβˆˆβ„pΓ—r\mathbf V_r\in\mathbb R^{p\times r}. Show that ridge multiplies the fitted response component in the jjth left singular-vector direction, for j=1,…,rj=1,\ldots,r, by

ρj(λ)=dj2dj2+nλ. \rho_j(\lambda) = \frac{d_j^2}{d_j^2+n\lambda}.

Suppose n=100n=100, Ξ»=0.01\lambda=0.01, and the nonzero singular values are

d1=10,d2=2,d3=0.2. d_1=10, \qquad d_2=2, \qquad d_3=0.2.

Calculate the three shrinkage factors and the total effective degrees of freedom, including the unpenalized intercept:

df⁑eff(Ξ»)=1+βˆ‘j=13ρj(Ξ»). \operatorname{df}_{\mathrm{eff}}(\lambda) = 1+\sum_{j=1}^3\rho_j(\lambda).

  1. Which direction receives the strongest shrinkage? Explain why shrinking this direction can reduce prediction variance. Under what circumstance could the same shrinkage produce substantial prediction bias?

Solution

Differentiate the objective with respect to 𝜷\boldsymbol\beta:

βˆ‡LΞ»(𝜷)=βˆ’1n𝑿𝖳(π’šΜƒβˆ’π‘Ώπœ·)+λ𝜷. \nabla L_\lambda(\boldsymbol\beta) = -\frac{1}{n} \mathbf X^{\mathsf T} (\widetilde{\mathbf y}-\mathbf X\boldsymbol\beta) + \lambda\boldsymbol\beta.

Setting the gradient equal to zero gives

1nπ‘Ώπ–³π‘Ώπœ·Μ‚Ξ»+Ξ»πœ·Μ‚Ξ»=1nπ‘Ώπ–³π’šΜƒ. \frac{1}{n} \mathbf X^{\mathsf T}\mathbf X \widehat{\boldsymbol\beta}_\lambda + \lambda\widehat{\boldsymbol\beta}_\lambda = \frac{1}{n} \mathbf X^{\mathsf T}\widetilde{\mathbf y}.

Multiplying by nn gives the stated normal equation and hence

πœ·Μ‚Ξ»=(𝑿𝖳𝑿+nλ𝑰p)βˆ’1π‘Ώπ–³π’šΜƒ. \widehat{\boldsymbol\beta}_\lambda = \left( \mathbf X^{\mathsf T}\mathbf X+n\lambda\mathbf I_p \right)^{-1} \mathbf X^{\mathsf T}\widetilde{\mathbf y}.

For every nonzero vector π’‚βˆˆβ„p\mathbf a\in\mathbb R^p,

𝒂𝖳(𝑿𝖳𝑿+nλ𝑰p)𝒂=‖𝑿𝒂‖22+nλ‖𝒂‖22>0 \mathbf a^{\mathsf T} \left( \mathbf X^{\mathsf T}\mathbf X+n\lambda\mathbf I_p \right) \mathbf a = \lVert\mathbf X\mathbf a\rVert_2^2 +n\lambda\lVert\mathbf a\rVert_2^2 >0

when Ξ»>0\lambda>0. The matrix is therefore positive definite and invertible, even when 𝑿𝖳𝑿\mathbf X^{\mathsf T}\mathbf X is singular.

Using the singular value decomposition,

πœ·Μ‚Ξ»=𝑽r(𝑫r2+nλ𝑰r)βˆ’1𝑫r𝑼rπ–³π’šΜƒ. \widehat{\boldsymbol\beta}_\lambda = \mathbf V_r \left( \mathbf D_r^2+n\lambda\mathbf I_r \right)^{-1} \mathbf D_r \mathbf U_r^{\mathsf T}\widetilde{\mathbf y}.

If r<pr<p, directions orthogonal to the columns of 𝑽r\mathbf V_r lie in the null space of 𝑿\mathbf X. Ridge sets those coefficient components to zero because they increase the penalty without changing the fitted response.

Multiplying by 𝑿=𝑼r𝑫r𝑽r𝖳\mathbf X=\mathbf U_r\mathbf D_r\mathbf V_r^{\mathsf T} gives

π‘Ώπœ·Μ‚Ξ»=βˆ‘j=1rdj2dj2+nλ𝒖j𝒖jπ–³π’šΜƒ. \mathbf X\widehat{\boldsymbol\beta}_\lambda = \sum_{j=1}^r \frac{d_j^2}{d_j^2+n\lambda} \mathbf u_j\mathbf u_j^{\mathsf T} \widetilde{\mathbf y}.

Thus, the fitted response component in direction 𝒖j\mathbf u_j is multiplied by ρj(Ξ»)\rho_j(\lambda). Here nΞ»=1n\lambda=1, so

ρ1=100101β‰ˆ0.9901,ρ2=45=0.8,ρ3=0.041.04β‰ˆ0.0385. \begin{aligned} \rho_1 &= \frac{100}{101} \approx0.9901,\\ \rho_2 &= \frac{4}{5} =0.8,\\ \rho_3 &= \frac{0.04}{1.04} \approx0.0385. \end{aligned}

Including the intercept,

df⁑eff(0.01)=1+0.9901+0.8+0.0385β‰ˆ2.8286. \operatorname{df}_{\mathrm{eff}}(0.01) = 1+0.9901+0.8+0.0385 \approx2.8286.

The third direction receives the strongest shrinkage. Its small singular value means that the data provide little information in that direction, so an unregularized estimate can have high variance. Shrinkage reduces this sensitivity to response noise. However, if the true mean response has a large component in the third left singular-vector direction, reducing that component to about 3.85%3.85\% of its least-squares value can introduce substantial prediction bias.

Question 4: Ridge regression and optimization

Original question

Let π‘Ώβˆˆβ„nΓ—p\mathbf X\in\mathbb R^{n\times p} be a centered predictor matrix with p=2p=2. Its columns need not have unit variance in this question. The intercept is fitted separately and is not penalized. Suppose the two eigenvalues of

𝑨0=1n𝑿𝖳𝑿 \mathbf A_0 = \frac{1}{n}\mathbf X^{\mathsf T}\mathbf X

are 99 and 0.010.01. Ridge regression with Ξ»=0.09\lambda=0.09 has curvature matrix

𝑨λ=1n𝑿𝖳𝑿+λ𝑰p. \mathbf A_\lambda = \frac{1}{n}\mathbf X^{\mathsf T}\mathbf X + \lambda\mathbf I_p.

  1. Calculate the condition numbers of 𝑨0\mathbf A_0 and 𝑨λ\mathbf A_\lambda. Explain what the change says about the geometry of the ridge objective.

  2. Gradient descent uses

𝜷(k+1)=𝜷(k)βˆ’Ξ·βˆ‡LΞ»(𝜷(k)). \boldsymbol\beta^{(k+1)} = \boldsymbol\beta^{(k)} - \eta\nabla L_\lambda\!\left(\boldsymbol\beta^{(k)}\right).

Let πœ·Μ‚Ξ»\widehat{\boldsymbol\beta}_\lambda be the ridge minimizer and define the optimization error

𝒆(k)=𝜷(k)βˆ’πœ·Μ‚Ξ». \mathbf e^{(k)} = \boldsymbol\beta^{(k)} - \widehat{\boldsymbol\beta}_\lambda.

Show that the component of 𝒆(k)\mathbf e^{(k)} in an eigendirection with unpenalized eigenvalue aa is multiplied at each step by

1βˆ’Ξ·(a+Ξ»). 1-\eta(a+\lambda).

Let M=9.09M=9.09, the largest eigenvalue of 𝑨λ\mathbf A_\lambda. Find the interval of step sizes that contracts every eigendirection. Then compare these two choices:

  • For Ξ·=1/M\eta=1/M, calculate the two contraction factors and explain which direction converges faster.
  • For Ξ·=2.1/M\eta=2.1/M, determine whether the method converges. Assume the initial error has a nonzero component in the eigendirection corresponding to MM.
  1. Increasing Ξ»\lambda generally improves the condition number. Explain why choosing Ξ»\lambda to make gradient descent converge as quickly as possible is not a valid statistical tuning rule.

Solution

The condition number is the ratio of the largest to the smallest eigenvalue. Without ridge,

ΞΊ(𝑨0)=90.01=900. \kappa(\mathbf A_0) = \frac{9}{0.01} =900.

Adding Ξ»=0.09\lambda=0.09 changes the two eigenvalues to

9+0.09=9.09and0.01+0.09=0.10. 9+0.09=9.09 \qquad\text{and}\qquad 0.01+0.09=0.10.

Therefore,

ΞΊ(𝑨λ)=9.090.10=90.9. \kappa(\mathbf A_\lambda) = \frac{9.09}{0.10} =90.9.

The ridge objective is still more curved in one direction than the other, but the disparity is much smaller. Its contours are less elongated, which improves numerical conditioning.

Let πœ·Μ‚Ξ»\widehat{\boldsymbol\beta}_\lambda denote the ridge minimizer and define

𝒆(k)=𝜷(k)βˆ’πœ·Μ‚Ξ». \mathbf e^{(k)} = \boldsymbol\beta^{(k)} - \widehat{\boldsymbol\beta}_\lambda.

Because the ridge objective is quadratic,

βˆ‡LΞ»(𝜷(k))=𝑨λ𝒆(k). \nabla L_\lambda(\boldsymbol\beta^{(k)}) = \mathbf A_\lambda\mathbf e^{(k)}.

The error update is consequently

𝒆(k+1)=(𝑰pβˆ’Ξ·π‘¨Ξ»)𝒆(k). \mathbf e^{(k+1)} = (\mathbf I_p-\eta\mathbf A_\lambda) \mathbf e^{(k)}.

In an eigendirection whose unpenalized eigenvalue is aa, 𝑨λ\mathbf A_\lambda has eigenvalue a+Ξ»a+\lambda. The corresponding error component is therefore multiplied by 1βˆ’Ξ·(a+Ξ»)1-\eta(a+\lambda).

Every direction contracts when

|1βˆ’Ξ·(a+Ξ»)|<1 |1-\eta(a+\lambda)|<1

for every eigenvalue. It is enough to impose

0<Ξ·<2M=29.09β‰ˆ0.2200. 0<\eta<\frac{2}{M} = \frac{2}{9.09} \approx0.2200.

For Ξ·=1/M\eta=1/M, the contraction factors are

1βˆ’9.099.09=0 1-\frac{9.09}{9.09}=0

in the strong direction and

1βˆ’0.109.09β‰ˆ0.9890 1-\frac{0.10}{9.09} \approx0.9890

in the weak direction. The strong-direction error disappears in one step, but the weak-direction error decreases slowly.

For Ξ·=2.1/M\eta=2.1/M, the strong-direction factor is

1βˆ’2.1(9.09)9.09=βˆ’1.1. 1-\frac{2.1(9.09)}{9.09} =-1.1.

Its magnitude exceeds one, so a nonzero initial error component in that eigendirection alternates sign and grows. Under the condition stated in the question, the method does not converge even though the weak-direction component may still contract.

The penalty defines the statistical estimator. A larger value can reduce variance and improve conditioning, but it also introduces more shrinkage bias. The step size and numerical algorithm should be chosen to solve the objective accurately. The penalty should be chosen using statistical information about prediction, such as cross-validation or GCV, rather than computational speed.

Question 5: Selecting the ridge penalty for real-estate prediction

Original question

The supplied data/realestate.csv contains 414 real-estate transactions from Sindian District, New Taipei City, Taiwan. The quantitative response price is the unit house price. The six predictors are the transaction date, house age, distance to the nearest mass rapid transit station, number of nearby convenience stores, latitude, and longitude. Treat all six predictors as quantitative in this question. The column row_id identifies an observation and must not be used as a predictor.

The file data/realestate-split-folds.csv assigns 332 observations to the training set and 82 observations to the final test set. It also gives ten fold labels for the training observations. Match the two files using row_id and do not use the test responses while selecting a model.

Use the penalty grid

Ξ›={0}βˆͺ{10βˆ’4+0.05l:l=0,…,120}. \Lambda = \{0\} \mathbin{\cup} \left\{ 10^{-4+0.05l}:l=0,\ldots,120 \right\}.

For every fit, center and standardize each predictor using only the observations available to that fit, with the variance divided by the number of fitting observations. Center the response and leave the intercept unpenalized.

  1. Perform ten-fold cross-validation over Ξ›\Lambda using the supplied training folds. Estimate the predictor means and scales separately within each set of nine training folds. For each Ξ»\lambda, calculate the mean validation MSE and SE⁑(Ξ»)\operatorname{SE}(\lambda), the sample standard deviation of the ten fold errors divided by 10\sqrt{10}. Use this SE for the conventional one-standard-error heuristic. Plot the mean validation MSE and identify Ξ»min\lambda_{\min}. Choose Ξ»1se\lambda_{\mathrm{1se}} as the largest candidate in Ξ›\Lambda, including OLS, satisfying

MSEΒ―(Ξ»)≀MSEΒ―(Ξ»min)+SE⁑(Ξ»min). \overline{\operatorname{MSE}}(\lambda) \leq \overline{\operatorname{MSE}}(\lambda_{\min}) + \operatorname{SE}(\lambda_{\min}).

  1. Use all n=332n=332 training observations to calculate the lecture’s GCV criterion for each Ξ»βˆˆΞ›\lambda\in\Lambda:

GCV⁑(Ξ»)=MSE⁑train(Ξ»){1βˆ’df⁑eff(Ξ»)/n}2. \operatorname{GCV}(\lambda) = \frac{ \operatorname{MSE}_{\mathrm{train}}(\lambda) }{ \left\{ 1-\operatorname{df}_{\mathrm{eff}}(\lambda)/n \right\}^2 }.

Here MSE⁑train\operatorname{MSE}_{\mathrm{train}} is the training MSE, and df⁑eff\operatorname{df}_{\mathrm{eff}} includes the unpenalized intercept, as in Question 3. Estimate means and scales once from all training observations and keep them fixed for this calculation. Plot the GCV curve and identify λGCV\lambda_{\mathrm{GCV}}.

  1. Fix all three choices before examining the test responses. Refit OLS and ridge at Ξ»min\lambda_{\min}, Ξ»1se\lambda_{\mathrm{1se}}, and Ξ»GCV\lambda_{\mathrm{GCV}} using all training observations. Report each model’s training MSE, test MSE, and effective degrees of freedom. Interpret the differences and explain why the model with the smallest observed test MSE must not be selected after viewing this table.
TipStarter workflow

After matching the two files by row_id, use this order:

for each validation fold:
    estimate predictor means and scales from the other nine folds
    for each lambda:
        fit on those nine folds and record validation MSE
summarize the ten fold errors and fix lambda_min and lambda_1se
compute GCV using all training observations and fix lambda_GCV
only then refit the four reported models and evaluate the test responses

Solution

The ridge fitting function below performs three statistical operations. It estimates the predictor means and scales from the fitting observations, solves the ridge normal equation on the standardized scale, and transforms the coefficients back to the original predictor scale for prediction. It is used for the final refits. In the cross-validation loop, each fold’s means, scales, and response center are computed once and reused across every penalty. In the GCV loop, the full training means, scales, and response center are likewise computed once and reused across the full penalty grid.

Write xβ€Ύj\bar x_j and sjs_j for the fitting-sample mean and scale of raw predictor jj, and yβ€Ύ\bar y for the fitting-sample response mean. The code uses x_bar, s, and y_bar for these quantities, X for standardized predictors, and beta_hat for their fitted slopes. Conversion to raw-scale coefficients is

Ξ²Μ‚raw,j=Ξ²Μ‚jsj,Ξ²Μ‚raw,0=yβ€Ύβˆ’βˆ‘j=1pxβ€ΎjΞ²Μ‚raw,j. \widehat\beta_{\mathrm{raw},j}=\frac{\widehat\beta_j}{s_j}, \qquad \widehat\beta_{\mathrm{raw},0}=\bar y-\sum_{j=1}^p\bar x_j\widehat\beta_{\mathrm{raw},j}.

The code calls these beta_hat_raw and raw_intercept. Both representations give the same predictions.

For GCV, use the training MSE and the total effective degrees of freedom. With n=332n=332 training observations and p=6p=6 predictors, the singular values djd_j of the standardized training matrix give

df⁑eff(Ξ»)=1+βˆ‘j=1pdj2dj2+nΞ». \operatorname{df}_{\mathrm{eff}}(\lambda) = 1+ \sum_{j=1}^p \frac{d_j^2}{d_j^2+n\lambda}.

The leading one accounts for the unpenalized intercept.

The quantity called cv_se below is the conventional one-standard-error summary across folds. Because the ten fitted training sets overlap, it is a useful model-selection heuristic, not an independent-sample standard error.

  • R
  • Python
Show the solution code
data_dir <- if (file.exists("data/realestate.csv")) {
  "data"
} else {
  "practice/weeks/week-03/data"
}

realestate <- read.csv(
  file.path(data_dir, "realestate.csv"),
  check.names = FALSE
)
split_folds <- read.csv(
  file.path(data_dir, "realestate-split-folds.csv"),
  check.names = FALSE
)
stopifnot(
  anyDuplicated(realestate$row_id) == 0,
  anyDuplicated(split_folds$row_id) == 0,
  nrow(realestate) == nrow(split_folds)
)
match_index <- match(split_folds$row_id, realestate$row_id)
stopifnot(
  !anyNA(match_index),
  setequal(realestate$row_id, split_folds$row_id)
)
course_data <- cbind(
  split_folds,
  realestate[
    match_index,
    setdiff(names(realestate), "row_id"),
    drop = FALSE
  ]
)
stopifnot(identical(course_data$row_id, split_folds$row_id))

feature_names <- c(
  "date", "age", "distance",
  "stores", "latitude", "longitude"
)
X_raw_all <- as.matrix(course_data[, feature_names])
y_all <- course_data$price
is_train <- course_data$split == "train"
X_train_raw <- X_raw_all[is_train, , drop = FALSE]
y_train <- y_all[is_train]
X_test_raw <- X_raw_all[!is_train, , drop = FALSE]
y_test <- y_all[!is_train]
folds <- course_data$cv_fold[is_train]

fit_ridge <- function(X_raw, y, lambda, X_raw_new = NULL) {
  n <- nrow(X_raw)
  p <- ncol(X_raw)
  x_bar <- colMeans(X_raw)
  X_centered <- sweep(X_raw, 2, x_bar, "-")
  s <- sqrt(colMeans(X_centered^2))
  X <- sweep(X_centered, 2, s, "/")

  y_bar <- mean(y)
  y_centered <- y - y_bar
  beta_hat <- solve(
    crossprod(X) +
      n * lambda * diag(p),
    crossprod(X, y_centered)
  )

  beta_hat_raw <- drop(beta_hat) / s
  raw_intercept <- y_bar - sum(x_bar * beta_hat_raw)
  y_hat <- raw_intercept + drop(X_raw %*% beta_hat_raw)

  singular_values <- svd(
    X,
    nu = 0,
    nv = 0
  )$d
  df_eff <- 1 + sum(
    singular_values^2 /
      (singular_values^2 + n * lambda)
  )

  y_hat_new <- NULL
  if (!is.null(X_raw_new)) {
    y_hat_new <- raw_intercept + drop(X_raw_new %*% beta_hat_raw)
  }

  list(
    y_hat = y_hat,
    y_hat_new = y_hat_new,
    df_eff = df_eff
  )
}

lambda_grid <- c(0, 10^seq(-4, 2, length.out = 121))
Show the solution code
# Preprocess each training fold once, then reuse it for every penalty.
fold_levels <- sort(unique(folds))
# Rows are folds; columns are penalties.
fold_mse <- matrix(
  NA_real_,
  nrow = length(fold_levels),
  ncol = length(lambda_grid)
)

for (k in seq_along(fold_levels)) {
  validation <- folds == fold_levels[k]
  X_fold_train_raw <- X_train_raw[!validation, , drop = FALSE]
  X_fold_validation_raw <- X_train_raw[validation, , drop = FALSE]
  y_fold_train <- y_train[!validation]
  y_fold_validation <- y_train[validation]

  x_bar <- colMeans(X_fold_train_raw)
  X_centered <- sweep(
    X_fold_train_raw, 2, x_bar, "-"
  )
  s <- sqrt(colMeans(X_centered^2))
  X <- sweep(
    X_centered, 2, s, "/"
  )
  X_validation <- sweep(
    X_fold_validation_raw, 2, x_bar, "-"
  )
  X_validation <- sweep(
    X_validation, 2, s, "/"
  )

  y_bar <- mean(y_fold_train)
  y_centered <- y_fold_train - y_bar
  n <- nrow(X)
  p <- ncol(X)
  gram <- crossprod(X)
  rhs <- crossprod(X, y_centered)

  for (l in seq_along(lambda_grid)) {
    lambda <- lambda_grid[l]
    beta_hat <- solve(
      gram + n * lambda * diag(p),
      rhs
    )
    y_hat_validation <- y_bar +
      drop(X_validation %*% beta_hat)
    fold_mse[k, l] <- mean(
      (y_fold_validation - y_hat_validation)^2
    )
  }
}

cv_mean <- colMeans(fold_mse)
cv_se <- apply(fold_mse, 2, sd) / sqrt(nrow(fold_mse))
min_index <- which.min(cv_mean)
lambda_min <- lambda_grid[min_index]
one_se_limit <- cv_mean[min_index] + cv_se[min_index]
lambda_1se <- max(lambda_grid[cv_mean <= one_se_limit])

# GCV uses one fixed full-training smoother across the penalty grid.
x_bar <- colMeans(X_train_raw)
X_centered <- sweep(X_train_raw, 2, x_bar, "-")
s <- sqrt(colMeans(X_centered^2))
X <- sweep(X_centered, 2, s, "/")
y_bar <- mean(y_train)
y_centered <- y_train - y_bar
n <- nrow(X)
p <- ncol(X)
gram <- crossprod(X)
rhs <- crossprod(X, y_centered)
singular_values <- svd(X, nu = 0, nv = 0)$d

gcv <- df_eff_path <- numeric(length(lambda_grid))
for (l in seq_along(lambda_grid)) {
  lambda <- lambda_grid[l]
  beta_hat <- solve(
    gram + n * lambda * diag(p),
    rhs
  )
  y_hat <- y_bar + drop(X %*% beta_hat)
  df_eff_path[l] <- 1 + sum(
    singular_values^2 /
      (singular_values^2 + n * lambda)
  )
  training_mse <- mean((y_train - y_hat)^2)
  gcv[l] <- training_mse /
    (1 - df_eff_path[l] / n)^2
}
lambda_gcv <- lambda_grid[which.min(gcv)]

positive <- lambda_grid > 0
positive_log_lambda <- log10(lambda_grid[positive])
ols_position <- min(positive_log_lambda) - 0.5
plot_position <- rep(ols_position, length(lambda_grid))
plot_position[positive] <- positive_log_lambda
penalty_position <- function(lambda) {
  if (lambda == 0) ols_position else log10(lambda)
}
axis_ticks <- pretty(range(positive_log_lambda))
par(mfrow = c(1, 2), mar = c(4.2, 4.3, 1.2, 0.7))

plot(
  plot_position,
  cv_mean,
  type = "n",
  xaxt = "n",
  xlab = expression(paste("OLS or ", log[10](lambda))),
  ylab = "Mean validation MSE",
  bty = "l"
)
axis(
  1,
  at = c(ols_position, axis_ticks),
  labels = c("OLS", axis_ticks)
)
polygon(
  c(plot_position, rev(plot_position)),
  c(
    cv_mean - cv_se,
    rev(cv_mean + cv_se)
  ),
  col = adjustcolor("#2F6FB3", alpha.f = 0.16),
  border = NA
)
lines(plot_position, cv_mean, col = "#2F6FB3", lwd = 2)
abline(
  v = penalty_position(lambda_min),
  col = "#C84A16",
  lty = 2,
  lwd = 2
)
abline(
  v = penalty_position(lambda_1se),
  col = "#13294B",
  lty = 3,
  lwd = 2
)
legend(
  "topleft",
  legend = c("Mean MSE and 1 SE", "CV minimum", "One SE"),
  col = c("#2F6FB3", "#C84A16", "#13294B"),
  lty = c(1, 2, 3),
  lwd = 2,
  bty = "n"
)

plot(
  plot_position,
  gcv,
  type = "l",
  col = "#2F6FB3",
  lwd = 2,
  xaxt = "n",
  xlab = expression(paste("OLS or ", log[10](lambda))),
  ylab = "GCV",
  bty = "l"
)
axis(
  1,
  at = c(ols_position, axis_ticks),
  labels = c("OLS", axis_ticks)
)
abline(
  v = penalty_position(lambda_gcv),
  col = "#C84A16",
  lty = 2,
  lwd = 2
)
legend(
  "topleft",
  legend = c("GCV", "GCV minimum"),
  col = c("#2F6FB3", "#C84A16"),
  lty = c(1, 2),
  lwd = 2,
  bty = "n"
)

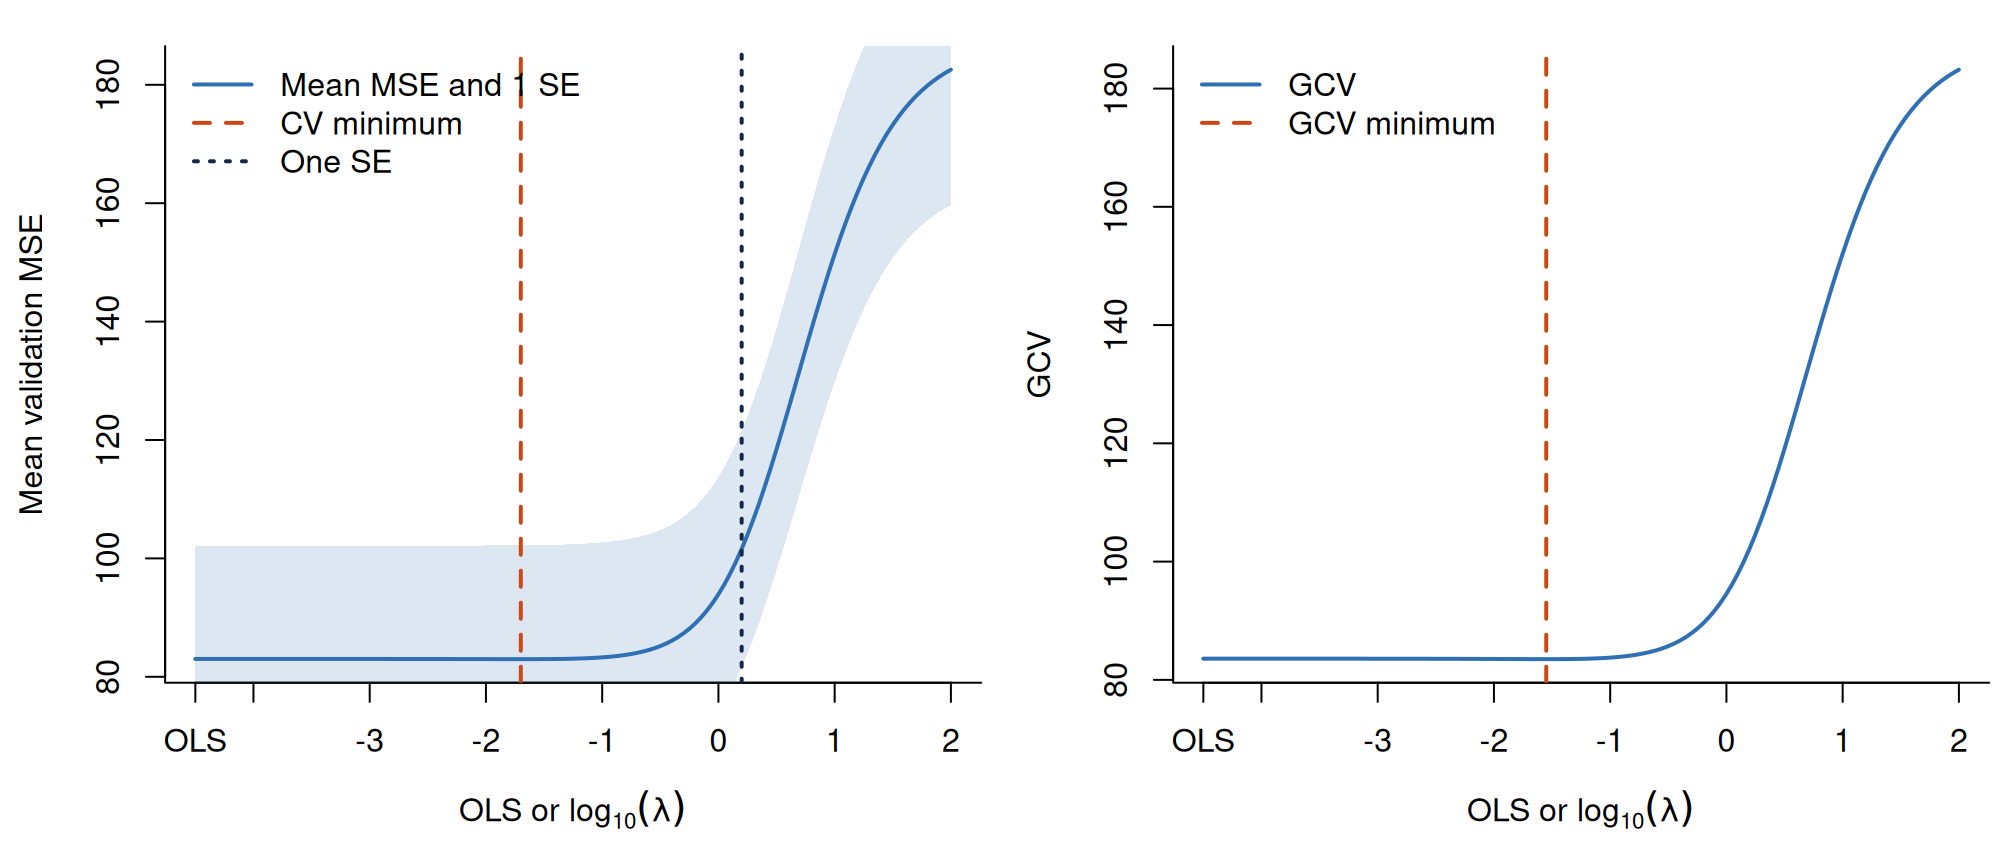
Two panels show validation MSE with a one-standard-error band and GCV against an axis containing an explicit OLS point followed by log base ten positive lambda. Vertical lines mark selected penalties.

Training-only penalty selection by ten-fold cross-validation and GCV.
Show the solution code
par(mfrow = c(1, 1))
Show the solution code
# Freeze every choice before evaluating the final test responses.
selected <- data.frame(
  rule = c("OLS", "CV minimum", "One SE", "GCV"),
  lambda = c(0, lambda_min, lambda_1se, lambda_gcv)
)
selected$df_eff <- NA_real_
selected$train_mse <- NA_real_
selected$test_mse <- NA_real_

for (l in seq_len(nrow(selected))) {
  fit <- fit_ridge(
    X_train_raw,
    y_train,
    selected$lambda[l],
    X_test_raw
  )
  selected$df_eff[l] <- fit$df_eff
  selected$train_mse[l] <- mean(
    (y_train - fit$y_hat)^2
  )
  selected$test_mse[l] <- mean(
    (y_test - fit$y_hat_new)^2
  )
}

print(c(
  lambda_min = lambda_min,
  lambda_1se = lambda_1se,
  lambda_gcv = lambda_gcv,
  one_se_limit = one_se_limit
), digits = 6)
  lambda_min   lambda_1se   lambda_gcv one_se_limit 
   0.0199526    1.5848932    0.0281838  102.2075631 
Show the solution code
knitr::kable(
  selected,
  digits = c(0, 5, 3, 3, 3),
  caption = "Final training and test comparison"
)
Final training and test comparison
rule lambda df_eff train_mse test_mse
OLS 0.00000 7.000 80.094 66.322
CV minimum 0.01995 6.773 80.135 66.000
One SE 1.58489 3.033 100.374 81.200
GCV 0.02818 6.689 80.171 65.903
Show the solution code
from pathlib import Path

import matplotlib.pyplot as plt
import numpy as np
import pandas as pd

data_dir = Path("data")
if not (data_dir / "realestate.csv").exists():
    data_dir = Path("practice/weeks/week-03/data")

realestate = pd.read_csv(data_dir / "realestate.csv")
split_folds = pd.read_csv(data_dir / "realestate-split-folds.csv")
assert realestate["row_id"].is_unique
assert split_folds["row_id"].is_unique
course_data = split_folds.merge(
    realestate,
    on="row_id",
    how="left",
    validate="one_to_one",
    indicator=True,
    sort=False,
)
assert len(course_data) == len(realestate)
assert course_data["_merge"].eq("both").all()
course_data = course_data.drop(columns="_merge")

feature_names = [
    "date", "age", "distance",
    "stores", "latitude", "longitude",
]
X_raw_all = course_data[feature_names].to_numpy(float)
y_all = course_data["price"].to_numpy(float)
is_train = course_data["split"].eq("train").to_numpy()
X_train_raw = X_raw_all[is_train]
X_test_raw = X_raw_all[~is_train]
y_train, y_test = y_all[is_train], y_all[~is_train]
folds = course_data.loc[is_train, "cv_fold"].to_numpy(int)


def fit_ridge(X_raw, y, lam, X_raw_new=None):
    n, p = X_raw.shape
    x_bar = X_raw.mean(axis=0)
    X_centered = X_raw - x_bar
    s = np.sqrt(np.mean(X_centered**2, axis=0))
    X = X_centered / s

    y_bar = y.mean()
    y_centered = y - y_bar
    beta_hat = np.linalg.solve(
        X.T @ X
        + n * lam * np.eye(p),
        X.T @ y_centered,
    )

    beta_hat_raw = beta_hat / s
    raw_intercept = y_bar - x_bar @ beta_hat_raw
    y_hat = raw_intercept + X_raw @ beta_hat_raw

    singular_values = np.linalg.svd(
        X,
        compute_uv=False,
    )
    df_eff = 1 + np.sum(
        singular_values**2
        / (singular_values**2 + n * lam)
    )
    y_hat_new = (
        None
        if X_raw_new is None
        else raw_intercept + X_raw_new @ beta_hat_raw
    )

    return {
        "y_hat": y_hat,
        "y_hat_new": y_hat_new,
        "df_eff": df_eff,
    }


lambda_grid = np.r_[0.0, 10 ** np.linspace(-4, 2, 121)]
Show the solution code
# Preprocess each training fold once, then reuse it for every penalty.
fold_levels = np.sort(np.unique(folds))
# Rows are folds; columns are penalties.
fold_mse = np.empty((len(fold_levels), len(lambda_grid)))

for k, fold in enumerate(fold_levels):
    validation = folds == fold
    X_fold_train_raw = X_train_raw[~validation]
    X_fold_validation_raw = X_train_raw[validation]
    y_fold_train = y_train[~validation]
    y_fold_validation = y_train[validation]

    x_bar = X_fold_train_raw.mean(axis=0)
    X_centered = X_fold_train_raw - x_bar
    s = np.sqrt(
        np.mean(X_centered**2, axis=0)
    )
    X = X_centered / s
    X_validation = (
        X_fold_validation_raw - x_bar
    ) / s

    y_bar = y_fold_train.mean()
    y_centered = y_fold_train - y_bar
    n, p = X.shape
    gram = X.T @ X
    rhs = X.T @ y_centered

    for l, lam in enumerate(lambda_grid):
        beta_hat = np.linalg.solve(
            gram + n * lam * np.eye(p),
            rhs,
        )
        y_hat_validation = (
            y_bar + X_validation @ beta_hat
        )
        fold_mse[k, l] = np.mean(
            (y_fold_validation - y_hat_validation) ** 2
        )

cv_mean = fold_mse.mean(axis=0)
cv_se = fold_mse.std(axis=0, ddof=1) / np.sqrt(fold_mse.shape[0])
min_index = int(np.argmin(cv_mean))
lambda_min = lambda_grid[min_index]
one_se_limit = cv_mean[min_index] + cv_se[min_index]
lambda_1se = lambda_grid[cv_mean <= one_se_limit].max()

# GCV uses one fixed full-training smoother across the penalty grid.
x_bar = X_train_raw.mean(axis=0)
X_centered = X_train_raw - x_bar
s = np.sqrt(np.mean(X_centered**2, axis=0))
X = X_centered / s
y_bar = y_train.mean()
y_centered = y_train - y_bar
n, p = X.shape
gram = X.T @ X
rhs = X.T @ y_centered
singular_values = np.linalg.svd(X, compute_uv=False)

gcv = np.empty(len(lambda_grid))
df_eff_path = np.empty(len(lambda_grid))
for l, lam in enumerate(lambda_grid):
    beta_hat = np.linalg.solve(
        gram + n * lam * np.eye(p),
        rhs,
    )
    y_hat = y_bar + X @ beta_hat
    df_eff_path[l] = 1 + np.sum(
        singular_values**2
        / (singular_values**2 + n * lam)
    )
    training_mse = np.mean((y_train - y_hat) ** 2)
    gcv[l] = training_mse / (
        1 - df_eff_path[l] / n
    ) ** 2
lambda_gcv = lambda_grid[int(np.argmin(gcv))]

positive = lambda_grid > 0
positive_log_lambda = np.log10(lambda_grid[positive])
ols_position = positive_log_lambda.min() - 0.5
plot_position = np.full(len(lambda_grid), ols_position)
plot_position[positive] = positive_log_lambda


def penalty_position(lam):
    return ols_position if lam == 0 else np.log10(lam)


fig, axes = plt.subplots(1, 2, figsize=(10.5, 4.4))

axes[0].fill_between(
    plot_position,
    cv_mean - cv_se,
    cv_mean + cv_se,
    color="#2F6FB3",
    alpha=0.16,
)
axes[0].plot(
    plot_position,
    cv_mean,
    color="#2F6FB3",
    linewidth=2,
    label="Mean MSE and 1 SE",
)
axes[0].axvline(
    penalty_position(lambda_min),
    color="#C84A16",
    linestyle="--",
    linewidth=2,
    label="CV minimum",
)
axes[0].axvline(
    penalty_position(lambda_1se),
    color="#13294B",
    linestyle=":",
    linewidth=2,
    label="One SE",
)
axes[0].set(
    xlabel=r"OLS or $\log_{10}(\lambda)$",
    ylabel="Mean validation MSE",
)
axes[0].legend(frameon=False)

axes[1].plot(
    plot_position,
    gcv,
    color="#2F6FB3",
    linewidth=2,
    label="GCV",
)
axes[1].axvline(
    penalty_position(lambda_gcv),
    color="#C84A16",
    linestyle="--",
    linewidth=2,
    label="GCV minimum",
)
axes[1].set(
    xlabel=r"OLS or $\log_{10}(\lambda)$",
    ylabel="GCV",
)
axes[1].legend(frameon=False)

for ax in axes:
    ticks = np.r_[ols_position, np.arange(-4, 3)]
    labels = ["OLS", "-4", "-3", "-2", "-1", "0", "1", "2"]
    ax.set_xticks(ticks, labels)
    ax.spines[["top", "right"]].set_visible(False)
fig.tight_layout()
plt.show()

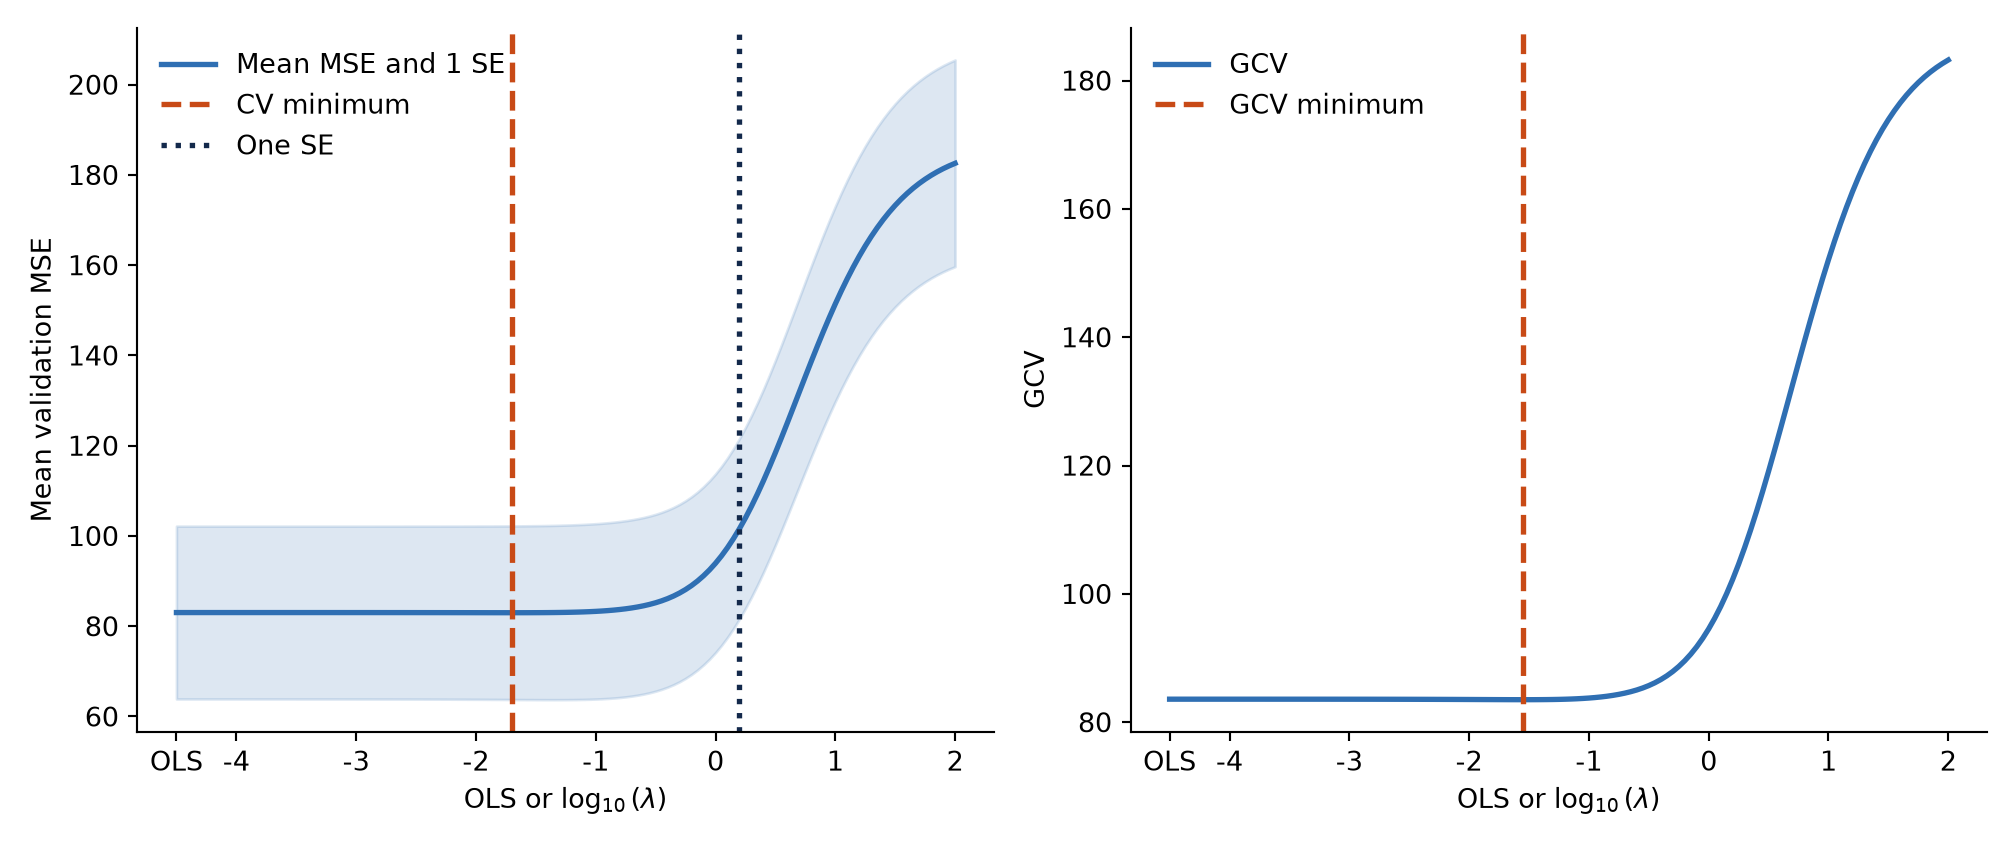
Two panels show validation MSE with a one-standard-error band and GCV against an axis containing an explicit OLS point followed by log base ten positive lambda. Vertical lines mark selected penalties.

Training-only penalty selection by ten-fold cross-validation and GCV.
Show the solution code
# Freeze every choice before evaluating the final test responses.
selected = pd.DataFrame(
    {
        "rule": ["OLS", "CV minimum", "One SE", "GCV"],
        "lambda": [0.0, lambda_min, lambda_1se, lambda_gcv],
    }
)
selected["df_eff"] = np.nan
selected["train_mse"] = np.nan
selected["test_mse"] = np.nan

for l, lam in enumerate(selected["lambda"]):
    fit = fit_ridge(X_train_raw, y_train, lam, X_test_raw)
    selected.loc[l, "df_eff"] = fit["df_eff"]
    selected.loc[l, "train_mse"] = np.mean(
        (y_train - fit["y_hat"]) ** 2
    )
    selected.loc[l, "test_mse"] = np.mean(
        (y_test - fit["y_hat_new"]) ** 2
    )

print(
    pd.Series(
        {
            "lambda_min": lambda_min,
            "lambda_1se": lambda_1se,
            "lambda_gcv": lambda_gcv,
            "one_se_limit": one_se_limit,
        }
    ).round(6)
)
lambda_min        0.019953
lambda_1se        1.584893
lambda_gcv        0.028184
one_se_limit    102.207563
dtype: float64
Show the solution code
print(selected.round(5).to_string(index=False))
      rule  lambda  df_eff  train_mse  test_mse
       OLS 0.00000 7.00000   80.09392  66.32246
CV minimum 0.01995 6.77321   80.13543  65.99957
    One SE 1.58489 3.03287  100.37356  81.19981
       GCV 0.02818 6.68866   80.17125  65.90276

The three training-only rules select

Ξ»min=0.01995,Ξ»1se=1.58489,Ξ»GCV=0.02818. \lambda_{\min}=0.01995, \qquad \lambda_{\mathrm{1se}}=1.58489, \qquad \lambda_{\mathrm{GCV}}=0.02818.

The minimum-CV and GCV choices are close. They retain effective degrees of freedom of approximately 6.776.77 and 6.696.69, respectively, including the intercept. The one-standard-error rule chooses much stronger regularization and reduces the effective degrees of freedom to about 3.033.03. The fold errors vary substantially, so the one-standard-error threshold permits a wide range of penalties.

The final comparison is approximately

Rule Ξ»\lambda Effective df Training MSE Test MSE
OLS 0 7.000 80.094 66.322
CV minimum 0.01995 6.773 80.135 66.000
One SE 1.58489 3.033 100.374 81.200
GCV 0.02818 6.689 80.171 65.903

OLS has the smallest training MSE, as expected. The minimum-CV and GCV ridge fits use mild shrinkage and have very similar test errors. The one-standard-error model has much stronger shrinkage and a larger test MSE on this particular test set.

This observed ordering does not invalidate the one-standard-error rule and does not authorize choosing GCV after seeing the test table. The three penalty rules were fixed using training information. The test set supplies one final assessment of those procedures. Selecting the smallest observed test MSE afterward would turn the test set into another validation set and make that minimum too favorable as an estimate of future performance.

GCV is also not an independent test result. It estimates prediction error from the training fit by correcting the training residuals using effective degrees of freedom. Finally, ridge controls coefficient variation within the specified linear model. It does not correct nonlinear structure, omitted variables, or other forms of model misspecification.

Reference

The real-estate data come from I-Cheng Yeh’s Real Estate Valuation dataset in the UCI Machine Learning Repository. The distributed data retain the original observations and add only the course train-test and fold assignments.

STAT 432 | Basics of Statistical Learning

 
  • Instructor